Air War
The two goals of this week’s blog post are as follow. Firstly, I would like to explore the mechanisms through which political advertising affects election outcomes and the implications for the 2020 election based off of partial advertising data. Next, I will construct a binomial logit probabilistic model and display the anticipated results of the 2020 election based off of 10,000 simulations using this binomial process.
Political Advertising
There is a lot of interest around whether advertising campaigns “work” (Huber, 2007). This makes sense for a number of reasons: political ads generate buzz and candidates spend millions of dollars in money and also campaign personnel manning advertising.
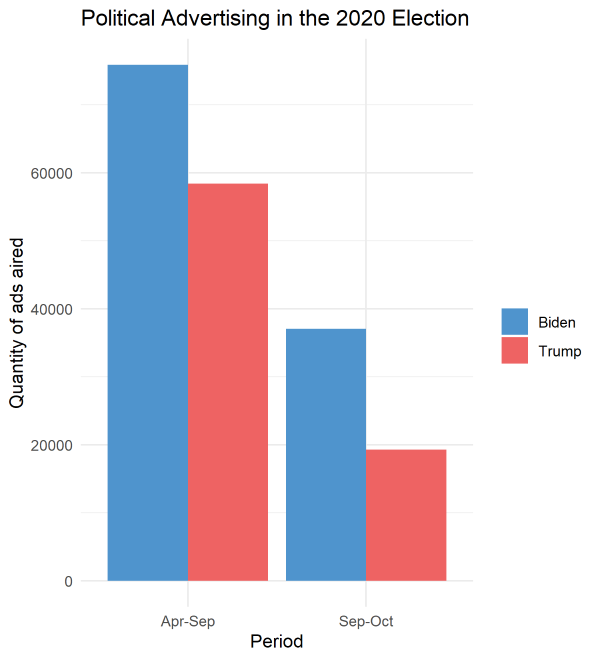
Biden has aired more ads in both April-September and September-October. As Election Day closes in, the quantity of advertising is sure to rise. Something curious that Wesleyan Media Project looks at is the disaggregation of advertising quantity across different platforms (TV, Facebook, etc.). Recent literature has shown that each platform serves a different purpose - for example, political ads on Facebook depend on strong partisan messaging to influence the quick process of information absorption on social media (Fowler, 2020)).
Because ads’ effects fade away largely within a week but are significantly strong, Biden’s higher quantity of ads airing is an important piece of the 2020 election. While the rest of my blog post will turn attention to probabilistic models, as more information on political advertising is released in the coming days and weeks.
Probabilistic Predictive Model
So far, we’ve explored the validity of weighted ensembles and univariate and multivariate linear regressions. However, the world is not as simple as to what a linear regression may reduce it to. Many variables’ causality on popular vote share are uncertain and are not independent of one another - for example, candidates who do well in the polls may also see some correlation with a thriving economy. Additionally, assuming every variable is additive and linear is an oversimplification of the complex process of voting. Therefore, one way to bypass this uncertainty is using a binomial logit model. In doing so, we calculate the probability of a candidate getting a certain share of the votes, based upon prior existing information on the voting eligible population and historical data. We then use the probability to conduct 10,000 simulations of this binomial process for each state to determine the distribution of Biden/Trump vote shares. With such a large number of simulations, we can expect the mean to eventually collapse over the previously calculated probability.
The following figure shows the distribution of Biden’s win margin in 10,000 simulations. The independent variable is the average support shown by polls 5 weeks before the election. I gathered data from 270towin, which shows the most current polling averages per state, in order to predict upon 2020 data. Sharp spikes to the right of x=0 indicate that the state leans Democrat, whereas sharp spikes to the left of x=0 indicate a Republican leaning.
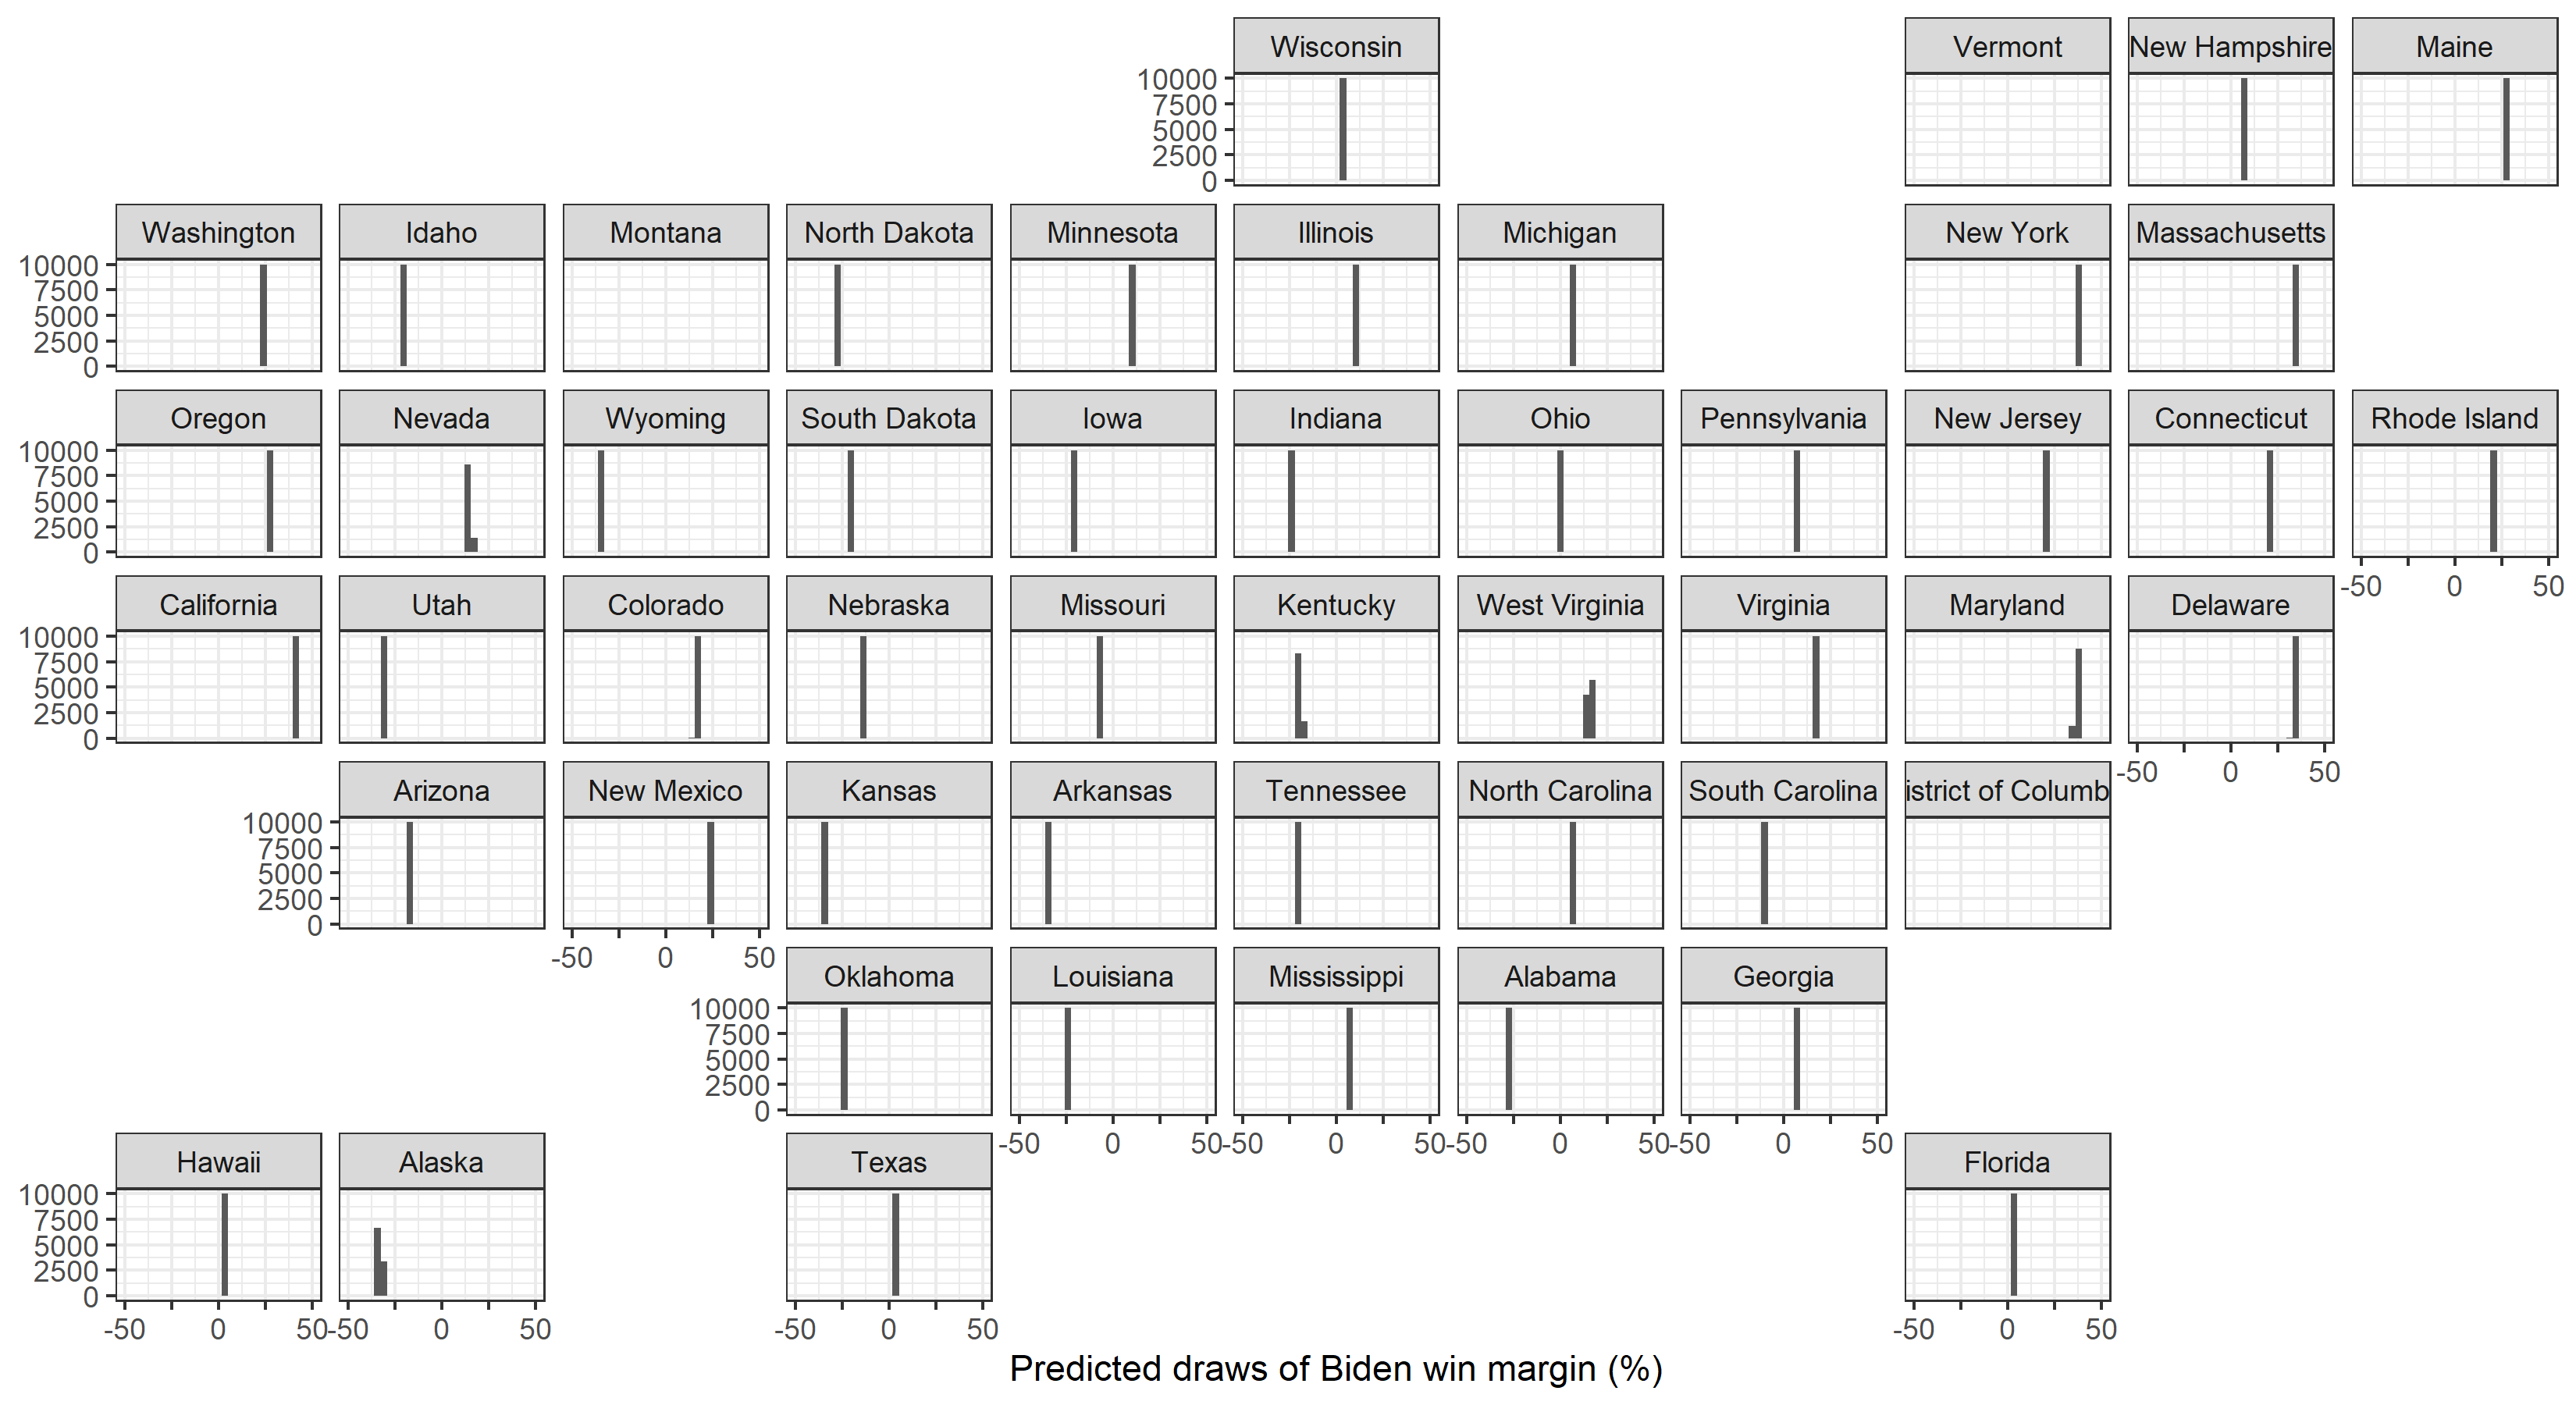
Note that Vermont, Montana, and D.C. are missing distributions due to the joining of multiple datasets, some of which did not contain information for the three voting regions.
But what does this really mean for the election? Translating distributions to actual election outcomes, I joined the number of electoral college votes per state and their projected partisan lean based off the binomial logit map above. Excluding Vermont and D.C., each of which have 3 electoral college votes but were missing in certain datasets, I projected that Biden would receive 382 electoral college votes compared to Trump’s 150.
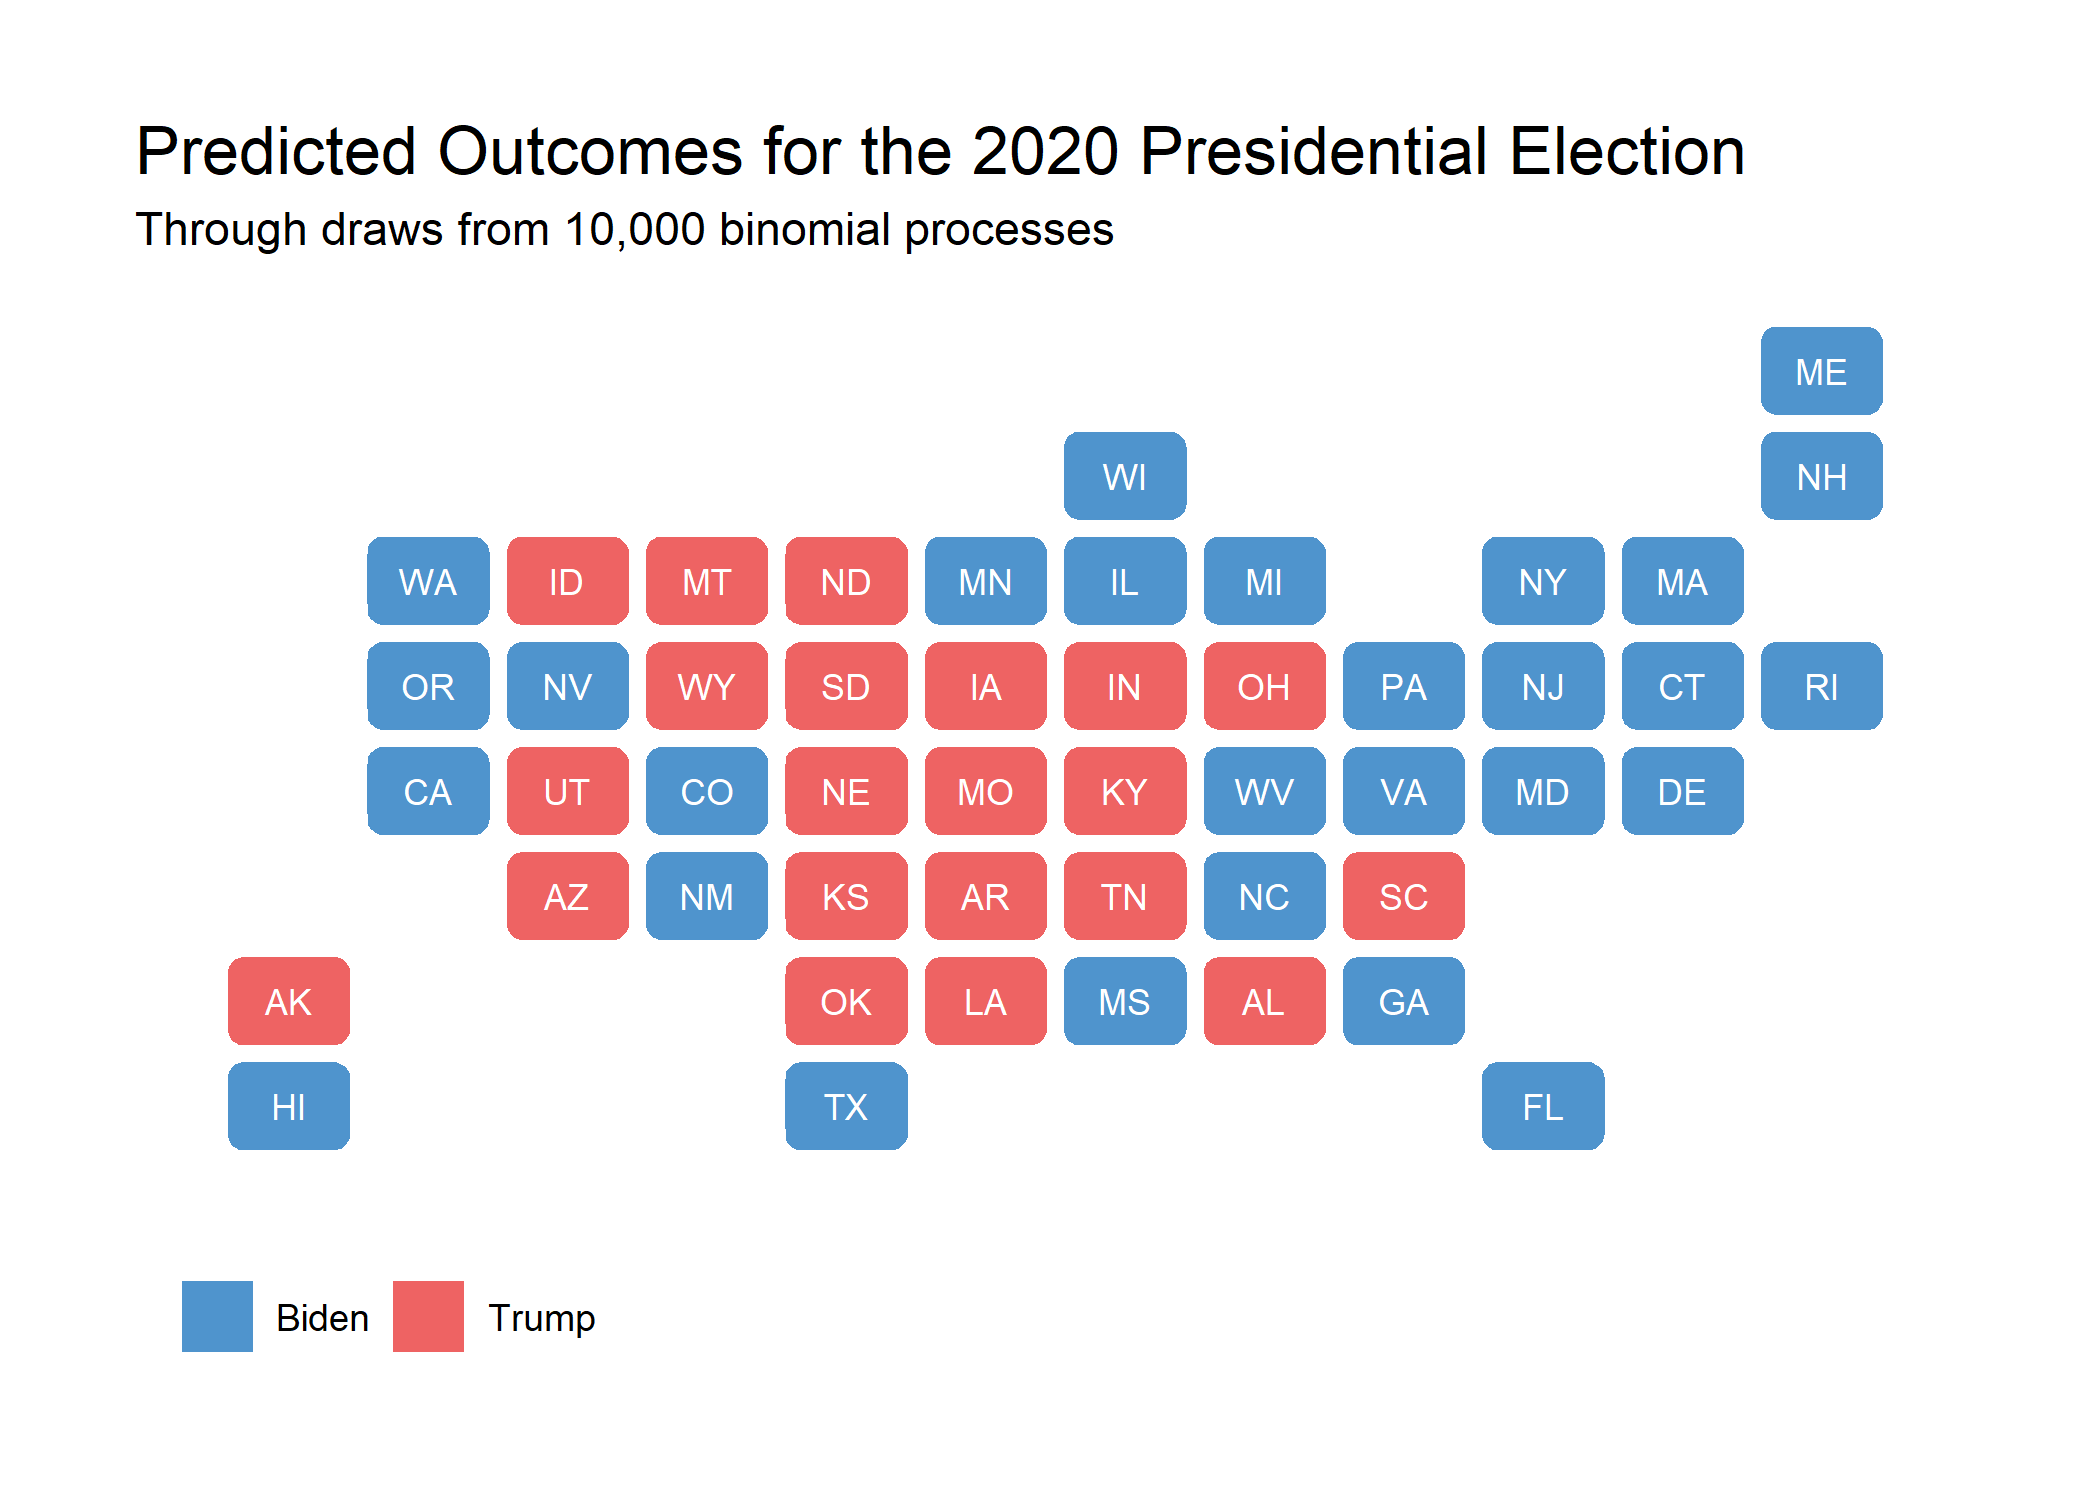
Interestingly, states such as Texas and Mississippi see Biden at a majority of the 2-party vote share rather than Trump. However, note that the point estimates are closer to 0 for these surprising findings, which makes sense, given that historically, Texas and Mississippi have been consistent red states. This model also pegs most swing states for Biden, including Pennsylvania, Florida, Michigan, and Wisconsin. Notably, however, Arizona is projected to toss their votes in for Trump. Given what we know about the convergence of polls on the true election outcome and model naivete (when using just one explanatory variable), I can say that this prediction is perhaps a little too optimistic for Biden. Nevertheless, it will be interesting to see how this prediction map changes as new poll data is made available.
Please note that these are point estimates. As speakers in our class have warned before, estimating to the point accurately is both practically impossible and substantively uninteresting. Future steps that I could take are incorporating standard errors into the prediction model.
You can find the replication scripts for graphics included in this week’s blog here. You can find the necessary data here.